The One Metric That Matters

Most agency case studies report clicks. We report purchased units.

Most dealer marketing agency results pages show impressions, click through rate, or leads generated. None of that reconditions a car, titles a car, or puts gross on your books. It is a scoreboard built to make an agency look busy, not one built to make you money.

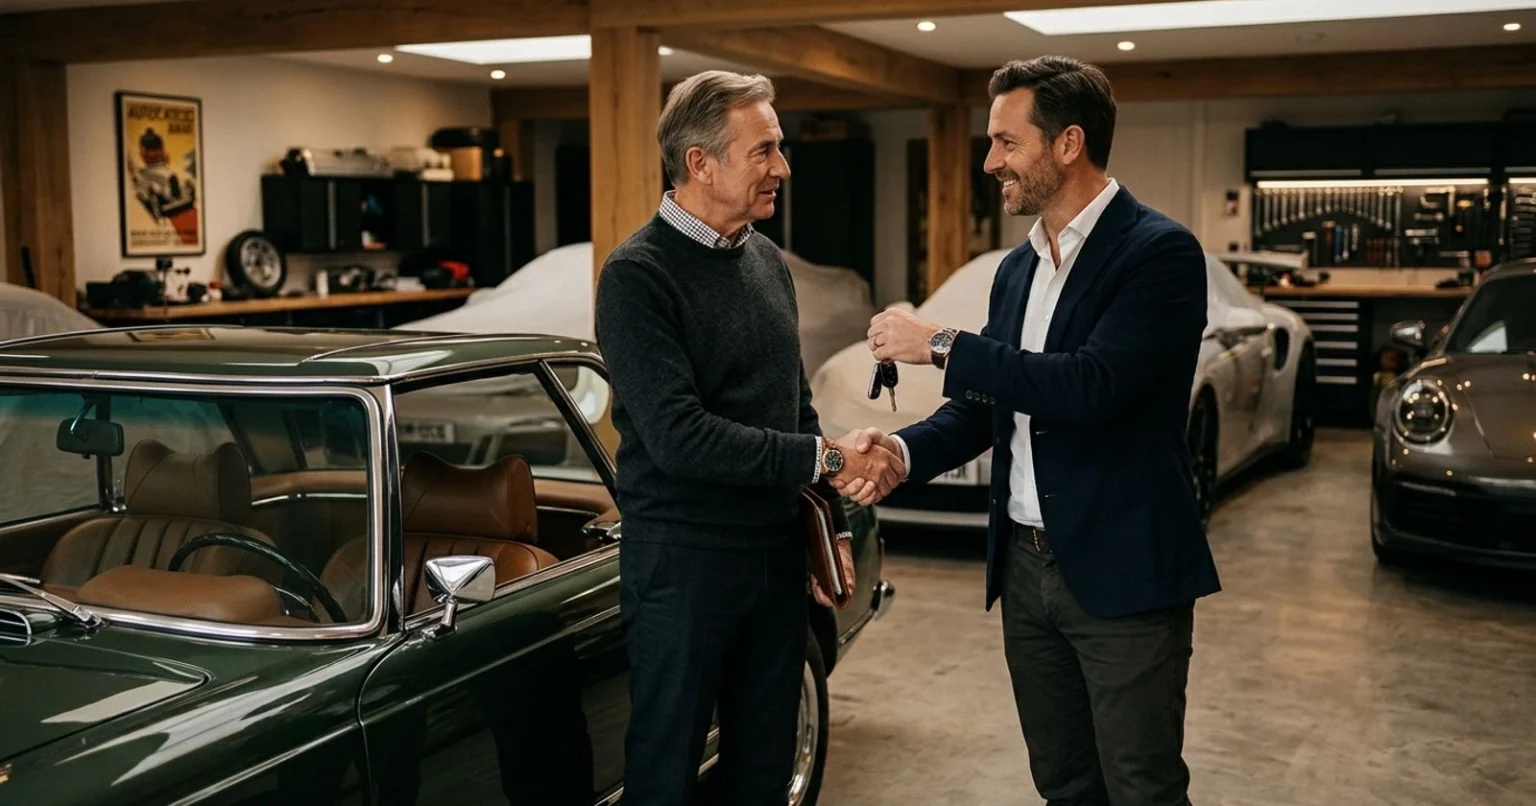
Dealer holding the keys to a purchased vehicle in front of a row of cars

What every case study below is measured by

  1. 1
    Purchased units per monthNot leads, not form fills.
  2. 2
    Cost per purchased unitNot cost per click or cost per lead.
  3. 3
    Lead to purchase timeHow fast a seller submission becomes a signed title.
  4. 4
    Percentage sourced first partyUnits bought through owned channels, not shared or paid only sources.

Results Across The Roster

Real scale. Real margins. Real partners.

  • 100+ Dealers, wholesalers & buying centers scaling
  • 400+ Units per month for multi rooftop groups
  • 100+ Units per month stabilized for wholesalers & independents
  • 100% First party seller data. Zero shared leads
  • 60-90 Days to meaningful purchased unit volume
  • 15-25% Seller funnel drop off, vs. 65-75% industry norm

Vehicle Acquisition Case Study Library

Acquisition results, by operation.

No two buying operations source the same way. A wholesaler's problem is not a franchise store's problem, and a four rooftop group's bottleneck is not an independent buying center's bottleneck. Below are the four operation types we build for most often, with the before and after acquisition volume for each.

To protect competitively sensitive buy box, margin, and sourcing data, case studies are reported as anonymized operation profiles rather than named accounts. See the FAQ below for why, and how to see named, verified results under NDA.

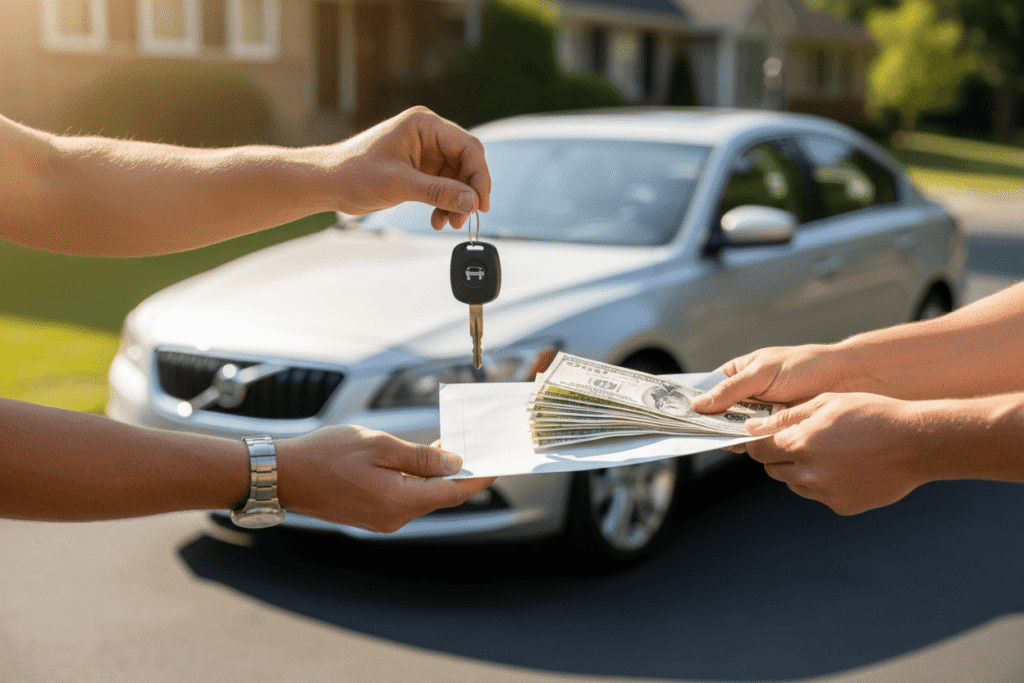
Private seller handing car keys to a buyer in exchange for cash

Case Study 01

Wholesale Buying Center
Southern California

Wholesaler acquisition case study: from auction dependent to 100+ owned units a month

13 weeksto stabilized volume

Before VehicquireAfter Vehicquire
Monthly volume Inconsistent, auction dependent 100+ purchased units / month
Lead source Auction lanes + shared lead vendors 100% exclusive, first party
Cost trend Rising as auction competition intensified Below auction + transport + recon risk baseline
  1. Situation

    This wholesale buyer had relied on auction lanes and shared lead providers for years. Volume swung month to month, and cost per unit kept climbing as auction competition intensified, with buy fees and transport costs eating margin before a car even reached the lot. There was no owned channel feeding the buying operation.

  2. Approach

    • Built a branded first party acquisition funnel: no shared leads, no split conversations with competing buyers
    • Launched a structured Meta campaign targeting private party sellers in their core buying geography and vehicle segments
    • Deployed CarHarvest AI intake to capture VIN, photos, and condition in under a minute, around the clock
    • Tracked every lead through to a purchased unit for a true cost per unit view, not just cost per lead
  3. Result

    Within the first full quarter live, the operation stabilized above 100 purchased units per month, sourced directly from private sellers, at a better acquisition margin than auction or shared lead purchases. The engagement paid for itself through margin improvement alone, before volume was even factored in.

The auction lane price was never the real cost. Buy fees, transport, and unknown condition were. Owning the seller relationship removed all three.
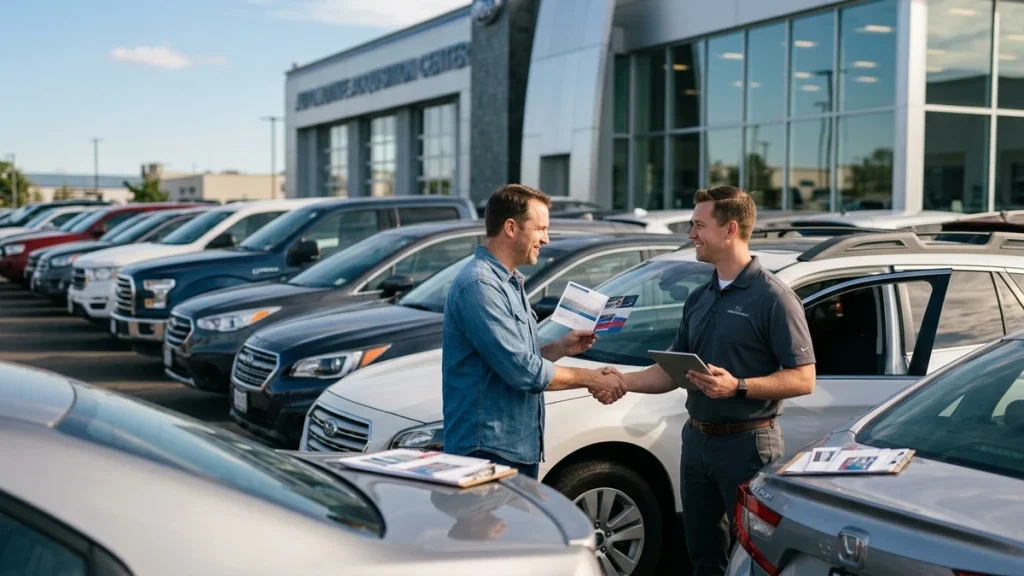
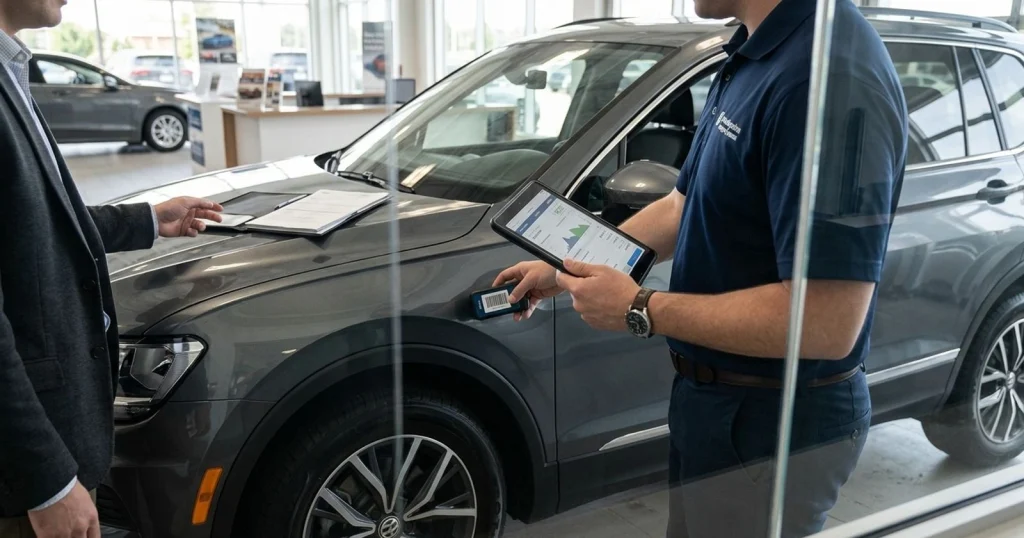
Dealer group buyers inspecting a vehicle on a dealership lot

Case Study 02

Multi Rooftop Dealer Group
Multiple Markets

Dealer group acquisition case study: centralizing to scale past 400 units a month

~2 quartersto full group wide scale

Before VehicquireAfter Vehicquire
Monthly volume Fragmented, store by store, no group view 400+ purchased units / month, group wide
Vendor structure Different vendor and creative per store One unified brand and infrastructure
CAC visibility No single cost per unit metric across rooftops One transparent, group wide CAC
  1. Situation

    A multi rooftop dealer group was running acquisition spend through different vendors at different stores, with inconsistent creative and no unified view of what was actually producing purchased units. Acquisition cost was climbing store by store, and used car managers were spending more time managing vendors than negotiating with sellers.

  2. Approach

    • Consolidated all rooftops under a single acquisition brand with store specific funnel variants
    • Unified paid traffic strategy across Meta and Google, using official Meta Partner and Google Partner infrastructure
    • Deployed CarHarvest AI at every location for around the clock seller engagement, with no store by store inconsistency
    • Built a single dashboard reporting cost per purchased unit by store, rolled up to a group wide metric leadership could act on
  3. Result

    Group wide scale to 400+ purchased units per month, with one transparent cost per purchased unit metric replacing a patchwork of vendor reports. Used car managers reclaimed the hours previously spent managing vendors and redeployed that time into negotiating directly with sellers.

Multi rooftop groups rarely have a demand problem. They have a fragmentation problem. Centralizing the brand fixed the metric before it fixed the volume.

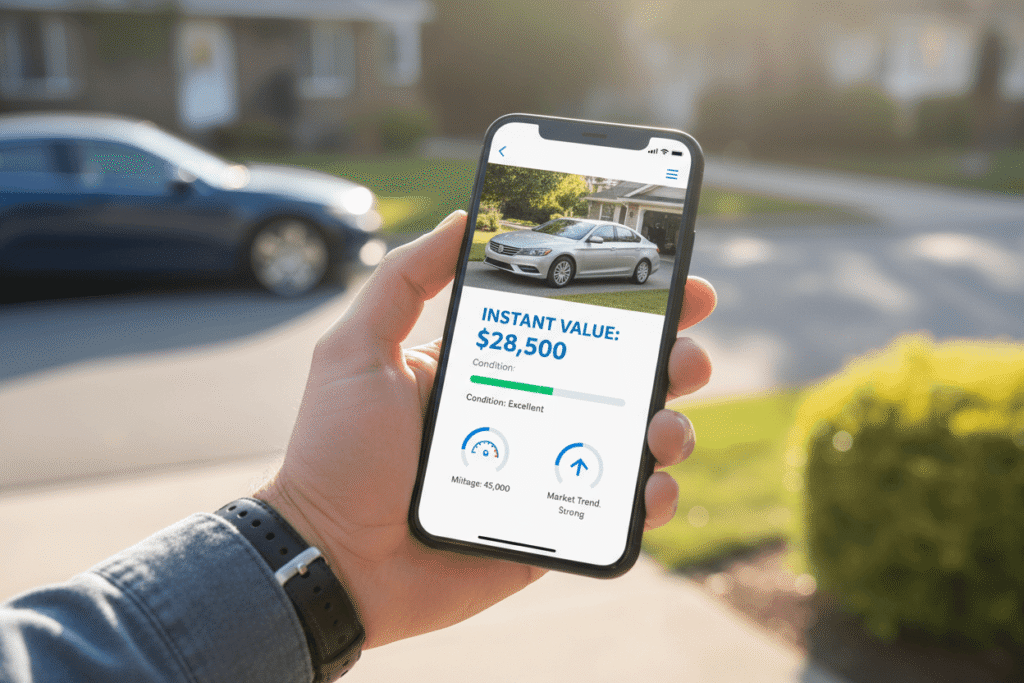
Seller checking an instant vehicle value on a phone before submitting their car

Case Study 03

Independent Dealer
Dedicated Buying Center

Private party acquisition results: independent buying center finds consistent flow

Day 71to first consistent 100 unit month

Before VehicquireAfter Vehicquire
Channels tried Direct mail, outdoor, shared leads, generic paid traffic One owned, branded acquisition funnel
Consistency No repeatable monthly output 100+ units / month, stabilized
Lead quality Cold, unqualified, manually chased Pre-qualified, VIN and photos on file
  1. Situation

    This independent dealer had already tried nearly everything: direct mail, outdoor advertising, shared lead providers, and generic paid traffic. Nothing produced the consistency their buying center needed to plan around.

  2. Approach

    • Built a dedicated, branded acquisition funnel specific to their buying center
    • Launched Meta campaigns targeting everyday, non luxury sellers across their core market
    • Integrated CarHarvest AI to qualify and intake every submission instantly, any time of day
  3. Result

    The buying center stabilized above 100 purchased units per month, with leads arriving pre-qualified: VIN, photos, and condition notes already captured before the buying team ever picked up the phone. The team stopped chasing cold leads entirely and spent their time only on sellers ready to negotiate.

Most independents do not actually have a lead volume problem. They have a qualification speed problem. They had leads before. They did not have a system fast enough to win the deal before a competing buyer did.

Service technician inspecting a customer vehicle with a tablet in the service drive

Case Study 04

Franchise Dealer
Used Car Department

Franchise dealer acquisition case study: layering private party sourcing onto trade and auction

90 daysto first 30 private party units

Before VehicquireAfter Vehicquire
Used inventory source Trade ins + auction only Trade + auction + owned private party channel
Front end used gross Compressed by trade and auction pricing Improved by a controlled, lower cost channel
Service drive traffic Untapped for acquisition Activated as a first party seller audience
  1. Situation

    This franchise store's used inventory came almost entirely from trade ins and auction. Front end used car gross stayed thin because both of those channels are priced against the dealer, not for the dealer. The store had no organized way to buy directly from private sellers in its own service drive or local market.

  2. Approach

    • Built a first party acquisition funnel targeting private sellers and the store's own service drive and past customer base: owned data the store already had, activated for the first time
    • Ran segment specific Meta and Google Search campaigns built around the store's specific buy box
    • Wired CarHarvest AI intake directly into the store's existing CRM, so the used car team had nothing new to learn
  3. Result

    Private party sourcing became a repeatable, controlled inventory channel running alongside trade and auction, at a materially lower cost per unit than auction buy fees, transport, and condition report risk combined, with the same used car headcount running meaningfully higher acquisition volume.

Franchise stores already have the trust advantage over an anonymous auction buyer. Most just never turned their own service drive traffic and local sellers into an acquisition channel with their brand behind it.

Acquisition Agency Proof

Before and after acquisition volume, side by side.

Operation TypeBefore VehicquireAfter VehicquireTime to Result
Wholesaler (SoCal) Auction + shared leads, inconsistent 100+ units/mo, exclusive leads 13 weeks
Multi-Rooftop Group Fragmented vendors, no unified CAC 400+ units/mo, group wide ~2 quarters
Independent Buying Center Direct mail + shared leads, no consistency 100+ units/mo, pre-qualified 71 days
Franchise Dealer Trade-in + auction only Owned private party channel added 90 days

Every row on this table represents the same underlying system: a first party funnel the operation owns, AI intake that qualifies a seller in under a minute, and paid traffic built around seller psychology instead of buyer psychology. The variable is not the system. It is the buy box, the market, and how fast the operation's team could act on qualified leads.

How We Measure It

The agency ROI case study framework behind every number above.

Cost per lead is a meaningless number in vehicle acquisition. A cheap lead that never converts to a purchased unit is more expensive than an efficient one that does. Here is what we actually track for every partner.

  1. 01
    Cost per purchased unitThe only acquisition metric that maps to gross profit.
  2. 02
    Lead to purchase conversion rateBroken out by vehicle segment: wholesale, everyday retail, highline, exotic, scrap.
  3. 03
    Response timeFrom seller submission to first qualified contact. Our benchmark is under one minute.
  4. 04
    Qualification accuracyThe percentage of AI-qualified leads that match a real, sellable vehicle in your buy box. 90%+ is the standard we build to.
  5. 05
    Percentage sourced first partyFirst party retargeting gets cheaper over time. Shared lead cost never does.
  6. 06
    Blended acquisition costBenchmarked against your current auction buy fee, transport, and condition report risk baseline.

Questions Dealers Ask

Frequently asked questions about these results

Dealership team reviewing a vehicle acquisition deal together
Are these real results, or projections?

Every case study on this page is built from actual partner engagements and reported using our standard reporting framework: cost per purchased unit, lead to purchase time, and first party sourcing percentage. Results vary by market, buy box, and how quickly an operation's team acts on qualified leads, which is why we show a range and a specific timeframe for each case study rather than a single average.

Why don't you use real dealer names or logos in these case studies?

Buy box, margin structure, and acquisition volume are competitively sensitive information for most of our partners, especially wholesalers and independents competing with other buyers in the same local market. We report results as anonymized operation profiles to protect that information. Named case studies, references, and direct introductions to current partners are available during a discovery call for serious prospects, under the same confidentiality standard we would extend to you.

How fast will I see results like these?

Most partners begin generating seller leads within the first one to two weeks of launch. The first 30 days are a structured build and learning phase. Most operations reach meaningful, repeatable purchased unit volume within 60 to 90 days, and operations with strong existing intake processes typically move faster.

Do these numbers apply to my size operation?

The case studies above span wholesalers, independents, multi rooftop groups, and franchise stores specifically because volume targets differ by operation type. A single buying center and a four rooftop group are not chasing the same number, and we do not sell either of them the same plan. We will tell you honestly during discovery what is realistic for your specific market and buy box.

What if my cost per unit is already lower than what's shown here?

Then the conversation is about volume and consistency, not just cost. Several of the operations above were not chasing a cheaper unit. They were chasing a repeatable one. If your cost per unit is already efficient, we will show you what it takes to scale that same efficiency to more units per month without your cost per unit climbing as volume increases.

Do you guarantee these results?

No agency that guarantees a specific acquisition volume before auditing your market, buy box, and current process is being straight with you. What we will commit to is the system: a first party funnel you own, AI intake benchmarked to under a one minute response time and 90%+ qualification accuracy, and transparent cost per purchased unit reporting from week one.

Accepting New Partners

See what your numbers could look like.

No pressure. No fluff. We will map your acquisition operation against the case studies above and tell you, honestly, what is realistic for your market and buy box.

Book Discovery Call

Meta Partner · Google Partner · Dealer-Built · You Own The Data

Book Discovery Call